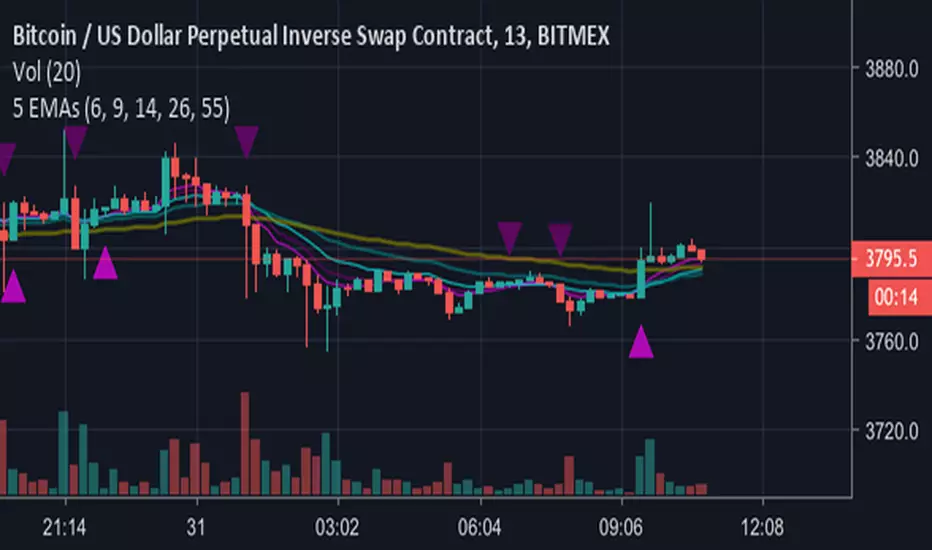
3 EMAsThis is just a simple script to put 3 EMAs on the chart at one time. Saves the trouble of putting the EMA Indicator on 3 times.
Default EMA Values are 50 (black), 21 (red) and 8 (blue). Of course you can change the period and color for each EMA to your liking.
It is a very simple script that i wrote for my own convenience, but wanted to share it with someone else so I figured the easiest way was to publish it.
Buscar en scripts para "3 ema"
ABK Multi EMA I really like to work with EMAs, but each time you use the "buit-in" one, you use one more slot in your indicators allowed.
So I built this simple one, 4 EMA in one indicator, and easy to use as following;
-displays 4 EMAs
-choose your EMA lenghts.
-choose your color and other options as needed.

Weekly OHLC Plus 3 Weekly TF EMAsPlots weekly OHLC (with option to turn on monthly Open and Close) and 3 Weekly resolution EMAs (customizable).
This indicator is a combination of a few I've created/updated here on TV.
First part plots Weekly OHLC with an option to plot monthly open and close.
This indicator also plots on your chart 3 EMAs (customizable) from the Weekly timeframe (resolution).
The default settings (all EMAs)
200 - Orange
50 - Purple
20 - Black
There is no smoothing so the EMA line will appear jagged.

5 EMAs plus Crossing AlertsHi all,
This is a simple indicator that plots 5 EMA lines of your choice to the screen.
Can be used to trigger scalping Bots (stoploss around 0.5% recommended, take profit 1% or higher, please backtest!)
Also can be used for manual scalping, 1 or 2 candles at a time.
Features:
1) Alerts are triggered when EMAs 1 (Signal line) and 2 (Baseline) cross - a Long signal is called if the cross is above EMA 3 (Trendline), a short if the cross is below EMA3
2) Signals are represented visually as a triangle on the chart, below the candles is a long, above is a short
3) TradingView Alerts can be easily set as I have labelled the signals clearly as many other Indicators like this aren’t easy to work out if trying to create alerts to trigger a 3commas bot, for example!
Each EMA is fully customisable and if you wish to take advantage of the alerts, only a few simple rules need to be followed:
EMA1 needs to be less than EMA2.
EMA2 needs to be the same or greater than EMA3
That’s it, happy trading!
Big shout out to B and the gang over at Crypto Trading Group!
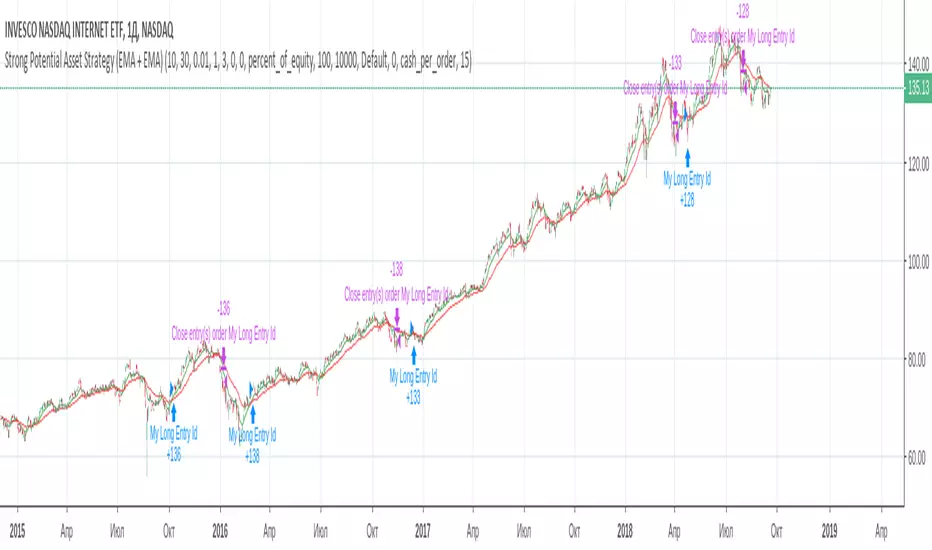
Strong Potential Asset Strategy (EMA + EMA)During experiments with the market, I found out that simple strategy is the best solution. However, I decided to bring some of my ideas on the 2 MA strategy.
- Instead of SMA - there will be 2 EMA, so the strategy will be more sensitive to the latest data;
- There is an option, which regulates the difference between those 2 EMAs, this should protect us from false trend enter;
- There is an option "Exit tolerance", which regulates how much could be the difference between 2 EMAs after crossover. This supposed to protect us from the false trend exit.
Hope this will be helpful :)
Moving Averages Bundle (EMA/SMA)Ver.4 (4/25/18)
EMA and SMA indicators ALL in one!
Default: SMA (20, 50, 100, 200) or EMA (8, 13, 21, 55)
Save your TV indicator use counts by using SMA/EMA
Functionality all in one indicator:
1) Toggle between Exponential or Simple moving averages.
2) Customize and or input your very own MA's by simply changing the input options from default.
3) Change color combos.
4) Turn off/on only the SMA/EMA's that you require.

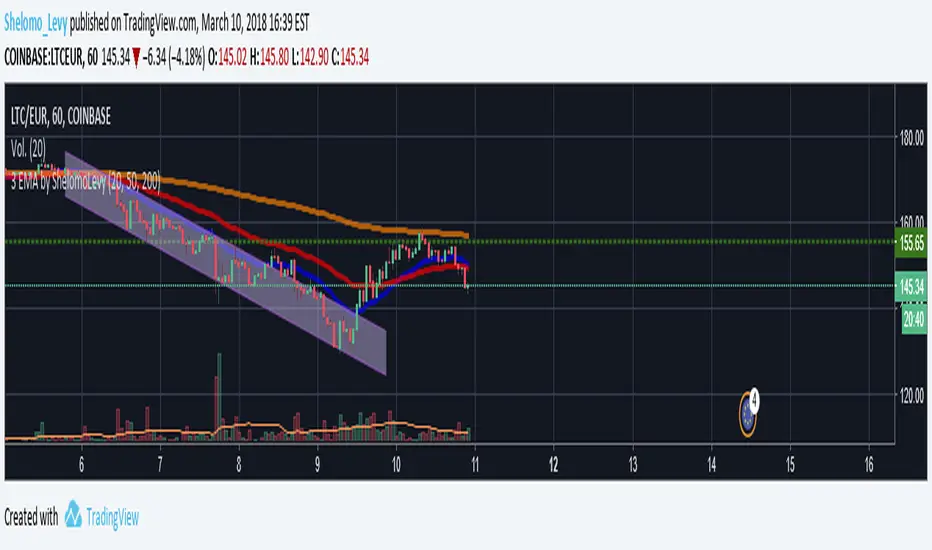
3 EMA by ShelomoLevy3 EMA
1. EMA 20 Periodos Color Azul Grosor 3
2. EMA 50 Periodos Color Rojo Grosor 3
3. EMA 200 Periodos Color Naranja Grosor 3
Trend with ADX, multiple EMAs - Buy & Sell✔ Trend Direction
Via DI+ > DI–
✔ Trend Strength
Via ADX
✔ Fast Entry Signals
5/8 EMA crossovers
✔ Larger Trend Confirmation
13/48 EMA crossovers
✔ Macro Trend
EMA 200
✔ Intraday Bias
VWAP
✔ Visual Trend (background)
✔ Alerts for signals + trend shifts

EMA Percent Angle & Slope VisualizerEMA Percent Angle & Slope Visualizer is a powerful trend-strength tool that measures the true geometric slope of an EMA using percent-normalized angle calculations.
Unlike raw angle or ATR-based angle methods, this indicator uses the formula:
angle = atan( (EMA_t - EMA_(t-1)) / EMA_(t-1) ) * (180 / pi)
This gives you a universal slope measurement that works across stocks, indices, currencies, and crypto — regardless of price scale.
🔍 Features
Percent-normalized EMA angle for accurate trend strength
Auto-detected slope segments
Dynamic EMA color
🟢 Bullish slope
🔴 Bearish slope
⚪ Neutral (angle below threshold)
Dashed slope lines drawn only during valid slope runs
Angle label displayed at slope end
Works on any timeframe
Designed for momentum traders, trend followers, breakout traders, and algo developers
📌 Why Percent-Normalized Angle?
Raw price angle is meaningless because angles depend on chart scaling.
Percent-normalized angle gives a true slope, equal across all instruments.
✔ Tip
Slopes above +0.15° and below –0.15° represent strong trend phases for Nifty.
Adjust threshold for your timeframe according to your script

EMA 21 & EMA 36 with Signals-RamanaReddyEMA 21 & EMA 36 with Signals avg
EMA crossover signals
Alerts on crossovers
Strategy backtest version

Moving Aaverage (EMA) & VWAP by Vish
Multi-Timeframe Moving Averages with VWAP
This indicator combines essential moving averages with VWAP to provide comprehensive trend analysis on a single chart. Designed for traders who need quick visual reference of multiple timeframes and volume-weighted price levels.
Features:
• Six customizable moving averages: 8, 13, 21, 50, 100, and 200 periods
• Toggle between Simple Moving Average (SMA) and Exponential Moving Average (EMA) for all lines
• Individual on/off controls for each moving average
• Volume Weighted Average Price (VWAP) with customizable settings
• VWAP anchor options: Session, Week, Month, Quarter, and Year
• Clean, color-coded visualization for easy identification
• Fully customizable through settings panel
Use Cases:
• Identify trend direction across multiple timeframes
• Find dynamic support and resistance levels
• Spot potential entry and exit points
• Analyze price action relative to volume-weighted average
• Confirm trend strength with multiple MA convergence/divergence
Settings:
All parameters are adjustable including MA type (SMA/EMA), individual MA visibility, VWAP source, and VWAP anchor period.
Suitable for all markets and timeframes. Works on stocks, forex, crypto, commodities, and indices.
#moving average #MA #EMA #SMA #VWAP #trend #support #resistance #multi-timeframe

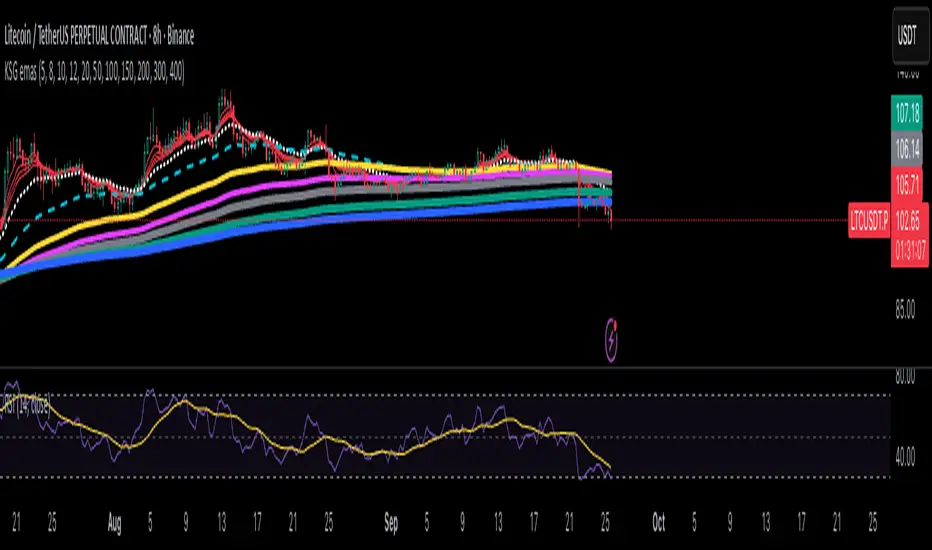
KSG emasThis script plots 10 customizable Exponential Moving Averages (EMAs). Each EMA length and color can be adjusted in the settings. It’s designed for traders who want to track multiple EMAs at once for trend analysis and strategy development.
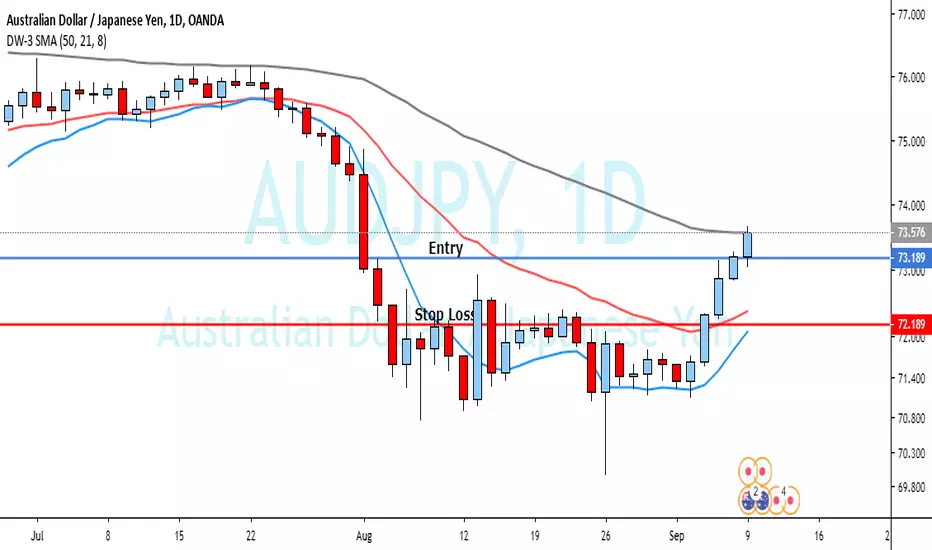
Adjustable EMA Cross with EMA50 & EMA200 FilterThis is a simple indicator utilizing a short and mid length EMA to trigger a buy alert when the short EMA crosses above the mid EMA and both are below the 50 and 200 EMA. The sell alert triggers when the opposite occurs. I use this indicator for trading Forex pairs.
BPS Multi-MA 5 — 22/30, SMA/WMA/EMA# Multi-MA 5 — 22/30 base, SMA/WMA/EMA
**What it is**
A lightweight 5-line moving-average ribbon for fast visual bias and trend/mean-reversion reads. You can switch the MA type (SMA/WMA/EMA) and choose between two ways of setting lengths: by monthly “session-based” base (22 or 30) with multipliers, or by entering exact lengths manually. An optional info table shows the effective settings in real time.
---
## How it works
* Calculates five moving averages from the selected price source.
* Lengths are either:
* **Multipliers mode:** `Base × Multiplier` (e.g., base 22 → 22/44/66/88/110), or
* **Manual mode:** any five exact lengths (e.g., 10/22/50/100/200).
* Plots five lines with fixed legend titles (MA1…MA5); the **info table** displays the actual type and lengths.
---
## Inputs
**Length Mode**
* **Multipliers** — choose a **Base** of **22** (≈ trading sessions per month) or **30** (calendar-style, smoother) and set **×1…×5** multipliers.
* **Manual** — enter **Len1…Len5** directly.
**MA Settings**
* **MA Type:** SMA / WMA / EMA
* **Source:** any series (e.g., `close`, `hlc3`, etc.)
* **Use true close (ignore Heikin Ashi):** when enabled, the MA is computed from the underlying instrument’s real `close`, not HA candles.
* **Show info table:** toggles the on-chart table with the current mode, type, base, and lengths.
---
## Quick start
1. Add the indicator to your chart.
2. Pick **MA Type** (e.g., **WMA** for faster response, **SMA** for smoother).
3. Choose **Length Mode**:
* **Multipliers:** set **Base = 22** for session-based monthly lengths (stocks/FX), or **30** for heavier smoothing.
* **Manual:** enter your exact lengths (e.g., 10/22/50/100/200).
4. (Optional) On **Heikin Ashi** charts, enable **Use true close** if you want the lines based on the instrument’s real close.
---
## Tips & notes
* **1 month ≈ 21–22 sessions.** Using 30 as “monthly” yields a smoother, more delayed curve.
* **WMA** reacts faster than **SMA** at the same length; expect earlier signals but more whipsaws in chop.
* **Len = 1** makes the MA track the chosen source (e.g., `close`) almost exactly.
* If changing lengths doesn’t move the lines, ensure you’re editing fields for the **active Length Mode** (Multipliers vs Manual).
* For clean comparisons, use the **same timeframe**. If you later wrap this in MTF logic, keep `lookahead_off` and handle gaps appropriately.
---
## Use cases
* Trend ribbon and dynamic bias zones
* Pullback entries to the mid/slow lines
* Crossovers (fast vs slow) for confirmation
* Volatility filtering by spreading lengths (e.g., 22/44/88/132/176)
---
**Credits:** Built for clarity and speed; designed around session-based “monthly” lengths (22) or smoother calendar-style (30).

5 EMA No-Touch Breakout 1:3 (Only 5m)This strategy is built for traders who want to ride strong trends using the principle of EMA rejection.
The concept is simple:
📉 Sell when price stays below the 5 EMA without touching it — indicating strong bearish momentum.
📈 Buy when price stays above the 5 EMA without touching it — indicating strong bullish momentum.

HILo Ema Squeeze BandsThis indicator combines uses ema to identify price squeeze before a big move.
The ema gets initialised at new high low. It used 3 ema's lengths. For result use x, 2x ,4x ie 50, 100, 200 or 100,200,400 and so on . On more volatile asset use a higher settings like 100,200,400. The inner band is divided into 4 zones, which can give support resistance. As you use it you will become aware of subtle information that it can give at times. Like you may be able to find steps at which prices move, when the market is trending
Just like in Bollinger bands, in a trending market the price stays within sd=1 and sd=2 so does in the inner band the price will remain in band1 and band2. But Bollinger band cannot print steps this indicator shows steps

RSI+EMA+MZONES with DivergencesFeatures:
1. RSI Calculation:
Uses user-defined periods to calculate the RSI and visualize momentum shifts.
Plots key RSI zones, including upper (overbought), lower (oversold), and middle levels.
2. EMA of RSI:
Includes an Exponential Moving Average (EMA) of the RSI for trend smoothing and confirmation.
3. Bullish and Bearish Divergences:
Detects Regular divergences (labeled as “Bull” and “Bear”) for classic signals.
Identifies Hidden divergences (labeled as “H Bull” and “H Bear”) for potential trend continuation opportunities.
4. Customizable Labels:
Displays divergence labels directly on the chart.
Labels can be toggled on or off for better chart visibility.
5. Alerts:
Predefined alerts for both regular and hidden divergences to notify users in real time.
6. Fully Customizable:
Adjust RSI period, lookback settings, divergence ranges, and visibility preferences.
Colors and styles are easily configurable to match your trading style.
How to Use:
RSI Zones: Use RSI and its zones to identify overbought/oversold conditions.
EMA: Look for crossovers or confluence with divergences for confirmation.
Divergences: Monitor for “Bull,” “Bear,” “H Bull,” or “H Bear” labels to spot key reversal or continuation signals.
Alerts: Set alerts to be notified of divergence opportunities without constant chart monitoring.

Synthetic EMA Momentum w/ DSL [Loxx]Synthetic EMA Momentum w/ DSL is a momentum indicator that is calculated with 5 different EMAs of increasing period to derive a final momentum value. This helps reduce noise and improve signal quality. Discontinued signal lines are uses to calculate signal values.
What are DSL Discontinued Signal Line?
A lot of indicators are using signal lines in order to determine the trend (or some desired state of the indicator) easier. The idea of the signal line is easy : comparing the value to it's smoothed (slightly lagging) state, the idea of current momentum/state is made.
Discontinued signal line is inheriting that simple signal line idea and it is extending it : instead of having one signal line, more lines depending on the current value of the indicator.
"Signal" line is calculated the following way :
When a certain level is crossed into the desired direction, the EMA of that value is calculated for the desired signal line
When that level is crossed into the opposite direction, the previous "signal" line value is simply "inherited" and it becomes a kind of a level
This way it becomes a combination of signal lines and levels that are trying to combine both the good from both methods.
In simple terms, DSL uses the concept of a signal line and betters it by inheriting the previous signal line's value & makes it a level.
Included:
Loxx's Expanded Source Types
Alerts
Signals
Bar coloring
Related indicators
Smoother Momentum MACD w/ DSL
T3 Velocity

Scalping EMA ADX RSI with Buy/Sell AlertsThis is a study indicator that shows the entries in the strategy seen in one of the youtube channel so it does not belong to me. I can't tell who it is because it's against the House Rules to advertise but you can find out if you look for it on youtube. Default values of oscilators and ema adjusted as suggested. He says he got the best results in 5 min timeframe but i tried to make things as modifiable as possible so you can mess around with the settings and create your own strategy for different timeframes if you'd like. Suggested to use with normal candlestick charts. The blue line below indicates the ADX is above the selected threshold set in the settings named "Trend Ready Limit". You can set alerts for Buy, Sell or Buy/Sell signal together.
The entry strategy itself is pretty straight forward.
The rules for entry are as follows, the script will check all of this on auto and will give you buy or sell signal :
Recommended time frame: 5 min
For Long Entry:
- Check if price above the set EMA (Can disable this rule if you'd like in the settings)
- RSI is in Oversold
- ADX is above set "Trend Ready" threshold (Meaning there is a trend going on)
- Price must approve the trend of previous candles. This is bullish for buy entries and bearish for sell entries.
- Enter with stop loss below last swing low with 1:1 or 1.5:1 take profit ratio.
For Short Entry:
- Check if price below the set EMA (Can disable this rule if you'd like in the settings)
- RSI is in Overbought
- ADX is above set "Trend Ready" threshold (Meaning there is a trend going on)
- Price must approve the trend of previous candles. This is bullish for buy entries and bearish for sell entries.
- Enter with stop loss above last swing high with 1:1 or 1.5:1 take profit ratio.
This is my first indicator. Let me know if you want any updates. I am not sure if i can add everything but i'll try nonetheless.
Changed: Signals will check up to 2 candles before if the RSI is below or above the set value to show signal. This is because sometimes the entry signal is right but the response might be a bit late.

Forex Fractal EMA ScalperThis is a forex scalper designed for very short timeframes 1-5 min max.
At the same time due to the short timeframe, is recommend to re optimize it weekly .
Its components are
Fractals
Triple EMA with different lengths
Rules for entry:
For long : we have an up fractal and all 3 ema are in ascending order
For short: we have a down fractal and all 3 ema are in descending order.
Rules for exit
We exit when we either get a reverse order or when we hit the take profit or stop loss calculated in fixed pips.

Crypto Scalper Divergence Macd Psar Ema 200This is a very efficient crypto scalper adapted to very short timeframes, however it can be optimized for other timeframes and assests as well.
Its components are
MACD
P SAR
EMA 200
Risk management
Rules for entry:
For short : we have an uptrend on PSAR , histogram is positive (divergence MACD) and close of a candle is below EMA 200
For long : we dont have an uptrend on PSAR, histogram is negative(divergence MACD) and close of a candle is above EMA 200
Rules for exit:
We exit when we either find a reverse condition than the entry one, or based on stop loss/take profit that are calculated on % movements of the price.
If you have any questions, let me know !

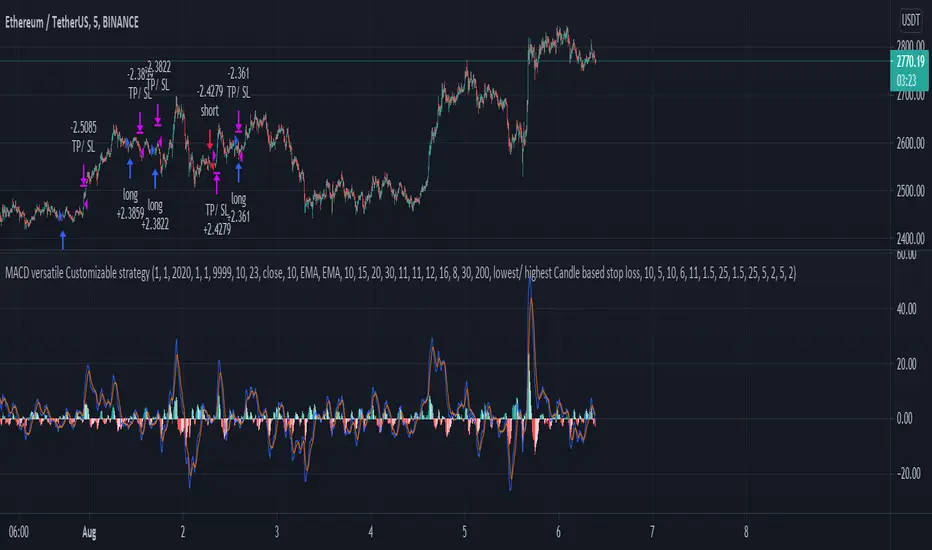
MACD, EMA, Know sure thing, Chopy Market - high adaptabilityHey there :)
This is the free version of the script. The following indicators / settings are missing:
- Support and resistance zones
- dynamic textboxes for alarms when using bots (3 Commas, Alertatron, etc.)
- a table showing the current position, indicators and other important information
With this script there is the possibility to completely customize the MACD . Starting with the MACD and signal line, the histogram and the color of the histogram.
Since the Pinecoders team has previously deleted the script, I will mention the fee settings in a bit more detail:
In this script a fee of 0.01% and a slipage of 15 was used. With each trade the total capital (100%) is used with a risk reward of 1 to 1.5.
The total capital, i.e. the risk, can be changed at any time under the "Settings" tab at "Equity".
I also added an EMA , the Know sure thing indicator and the Chopy Market indicator (by TradingRush) to the script to filter out bad trades.
The EMA:
Since the EMA is very reliable and shows whether there is an upward or downward trend, it should be used with the indicators in any case. It prevents long trades in downward movements and vice versa.
The KST Indicator:
The KST indicator has a similar movement as the MACD, but is by and large a bit more time delayed. It filters out false swings of the MACD and thus prevents bad trades.
The Chopy Market Indicator by Tradingrush:
The Chopy Market indicator, which was introduced by TradingRush in one of its videos, has the ability to detect sideways markets and block zones below this line for trades by means of a fixed value (the line).
To exit the trades, I added the following options:
ATR Exits. Exits based on past candles (lowest low, highest high).
Static exits based on set percentages.
In the next days I will create a tutorial for the script, just have a look on my profile.
If you have any questions about the script, let me know.